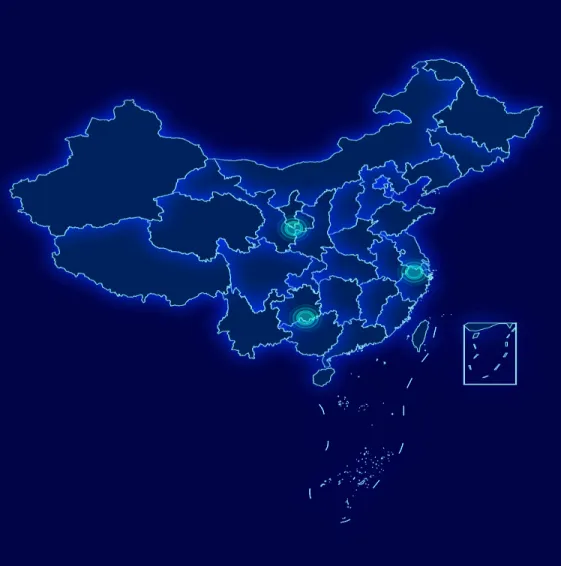
本文当介绍一种具有发光效果的中国地图实现方案。
1、预览效果

2、实现原理
基于大屏自定义图表+geoJson+echarts实现
3、配置步骤
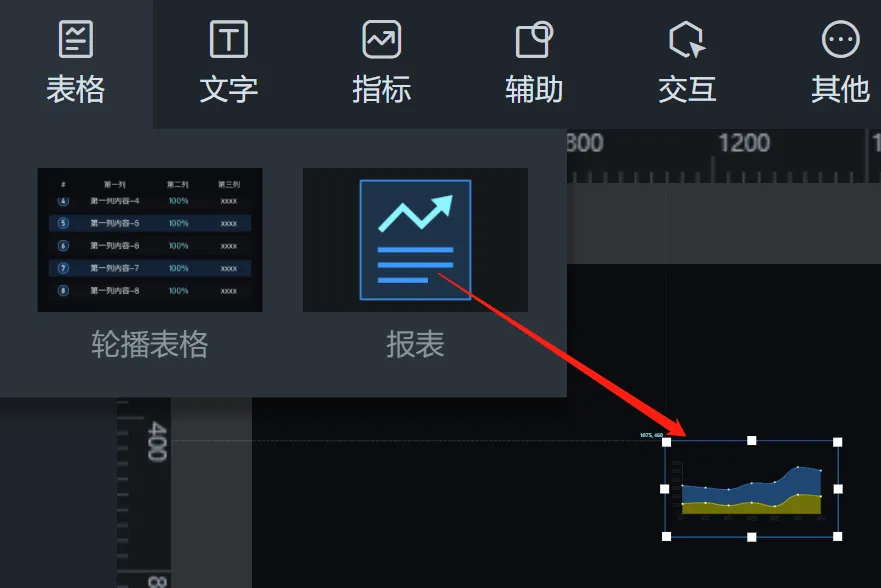
3.1、创建自定义图表

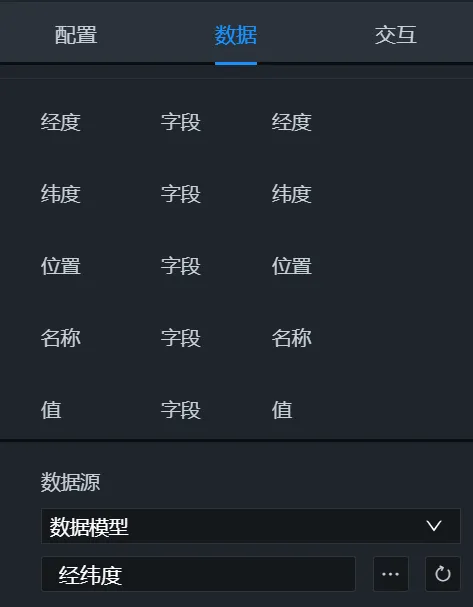
3.2、更改数据栏中的数据源
将数据模型设置为经纬度

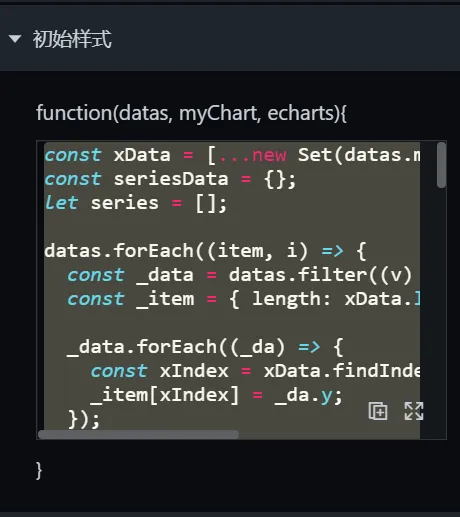
3.3、配置初始样式

const longitude = [...new Set(datas.map((v) => v.经度))];
const latitude = [...new Set(datas.map((v) => v.纬度))];
const geoCoordList = longitude.map((item,index) => {
    return [item, latitude[index]];
  });//相当于x
const res = []
datas.forEach((item, i) => {
    res.push({
      name: item.名称,
      value: geoCoordList[i].concat(item.值)
    })
  console.log(res,'res')
  return res
});
let series = [];
const china = 'https://geo.datav.aliyun.com/areas_v3/bound/100000_full.json'
//引入中国geoJson
$.getJSON(china, function (geoJson) {
  echarts.registerMap('china', geoJson);
  series.push({
      type: 'map',
      coordinateSystem: 'geo',
      showLegendSymbol: false,
      tooltip:{
          show:false
      },
      label: {
          normal: {
              show: false
          },
          emphasis: {
              show: false
          }
      },
      roam: false,
      itemStyle: {
          normal: {
              areaColor: '#01215c',
              borderColor: '#3074d0',
              borderWidth: 1
          },
          emphasis: {
              areaColor: '#01215c'
          }
      },
  },{
    name: '散点',
            type: 'effectScatter',
            coordinateSystem: 'geo',
            data: res,
            symbolSize: 20,
            symbol: 'circle',
            label: {
                normal: {
                    show: false
                },
                emphasis: {
                    show: false
                }
            } ,
            showEffectOn: 'render',
      itemStyle: {
          normal: {
              color: {
                  type: 'radial',
                  x: 0.5,
                  y: 0.5,
                  r: 0.5,
                  colorStops: [{
                      offset: 0,
                      color: 'rgba(14,245,209,0.2)'
                  }, {
                      offset: 0.8,
                      color: 'rgba(14,245,209,0.2)'
                  }, {
                      offset: 1,
                      color: 'rgba(14,245,209,1)'
                  }],
                  global: false // 缺省为 false
              },
          }

      },
  });
  const option = {
  backgroundColor: '#010347',
  geo: {
      show: true,
      map: 'china',
      label: {
          emphasis: {
              show: true,
              color: '#fff'
          }
      },
      roam: false,
      itemStyle: {
          normal: {
              areaColor: '#01215c',
              borderWidth: 1,//设置外层边框
              borderColor:'#9ffcff',
              shadowColor: 'rgba(0,54,255, 1)',
              shadowBlur: 30
          },
          emphasis:{
              areaColor: '#01215c',
          }
      }
  },
  tooltip: {
    trigger: 'item',
    formatter: function (params){
        return params.name + ' : ' + params.value[2];
    }
  },
  series: series
};
  myChart.setOption(option);
})
作者:倪 创建时间:2024-08-01 14:04
最后编辑:倪 更新时间:2025-09-03 16:32
最后编辑:倪 更新时间:2025-09-03 16:32
 扫码关注网盛数新公众号,获取更多帮助资料
